The Mathematics:
Some Mathematics of Voting Theory
An election procedure takes the voters’ ballots or ranking of the n candidates
(see “How to Vote”) and returns
a ranking of the candidates (if there is a tie, then there may be rankings
of the candidates). As such, an election procedure can be viewed
as a map from the set of all possible ballots to a final ranking. Mathematics
is used not only to study a specific map or election procedure, but also
classes of procedures – or
all election procedures, as Arrow’s
Impossibility Theorem demonstrates.
Further, mathematics can be used to restrict the set of ballots or to decompose the set into pieces that drive particular behavior. In either case, mathematics of voting theory focuses on the structure of the maps and the structure of the set of ballots. Below are structure-related phenomena and brief explanations of how the phenomena arise in voting theory. The material focuses on elections with three candidates, but the ideas extrapolate to any number of candidates.
Symmetry
A reasonable election procedure should not depend on the name of the candidates, just how the ballots are marked. For example, suppose that the ballots are cast and an election outcome yields A top-ranked, then B in second place, and C ranked last. If everyone switched the positions of A and B on their ballots, then the result should change accordingly. That is, B should be top-ranked, then A in second place, followed by C bottom-ranked. Such a change in the preferences is the same as if candidates A and B had switched their names! A procedure shouldn’t depend on how the candidates are named, but on how the votes are distributed. Switching candidates A and B (and leaving C fixed) is an example of a permutation. The set of all possible permutations of candidates on the ballots is called the symmetric group.
The Condorcet cycle (described on “From Impossibility to Possibilities”) is an example of another type of symmetry. For example, one Condorcet cycle for three candidates A, B, and C has A preferred to B (in a simple pairwise comparison, under majority rule), B preferred to C, and C preferred to A. The simplest example of a set of ballots which demonstrate this cyclic behavior is:
Of course, there is another possible Condorcet cycle in which C is preferred to B, B is preferred to A, and A is preferred to C. Grouping the ballots of the electorate into subsets with symmetric properties often is a useful way to understand how an election procedure treats different types of ballots.
Donald G. Saari (University of California, Irvine) introduced another
type of symmetry for rankings of candidates. He refers to reversal symmetry as taking a rank ordering of the candidates, and well, reversing them. Hence,
the two ballots below are reversals of one another:
He argues that if there are only two voters whose ballots are reversals of one another, then the only election procedure that will return a three-way tie between the candidates is the Borda count. Perhaps, surprisingly, if you reversed every ballot, the outcome of a new election may not be the reversal of the original outcome.
Geometry
Geometry can be used to represent the ballots of the voters. The triangle on the left (below) shows the six possible ways that three candidates can be ranked. The triangle on the right (below) shows the number of voters for each type of ballot. For example, there are four voters who have A top-ranked, B second-ranked, and C bottom-ranked. The triangle on the right gives the data from the example described on “Same Ballots, Many Outcomes.”
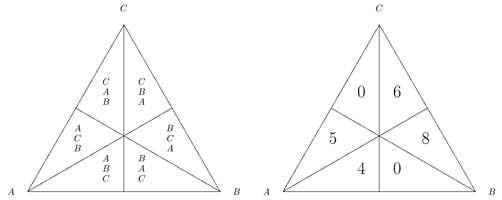
The triangle is a useful device to create numerical examples of different
voting theory paradoxes, or counterintuitive outcomes. For example,
9 (= 0 + 5 + 4) voters prefer candidate A to candidate B – the sum
of the numbers on the left-hand side of the above triangle. Geometrically,
the left-side of the triangle is closer to A than B in the triangle, which
translates to voters with those ballots preferring A to B. Similarly,
12 (= 4 + 0 + 8) voters prefer B to C. The triangle ABC is also
divided in half by a segment that goes through the vertex A. The
rankings below this segment have B preferred to C. Finally, 14 (=
0 + 6 + 8) voters prefer C to A, as these values are in the cells on the
side of the triangle closer to C than to A. Putting this data together,
B is preferred both to A and to C. Hence,
B is the Condorcet winner.
The triangle can also be used to determine the election outcome under
any voting vector. Consider the voting vector in which the top-ranked
candidate receives w1 points, the second-place candidate receives w2 points,
and the third-place candidate receives w3 =
0 points. Using the above (right) triangle, it is possible to determine
how many points A receives. There are 9 (= 5 + 4) voters who have
A top-ranked. There are 0 (= 0 + 0) voters that have A ranked second. And,
finally, there are 14 (= 6 + 8) who have A bottom-ranked. Hence,
A receives (9 x w1) + (0 x w2) + (14 x 0) = 9w1 points
under the voting vector.
The triangle encodes the preferences of all voters (the numbers in the
cells of the triangle). Hence, it is easy to compute election outcomes
and to compare what happens as the election procedure changes. By
filling in values into the cells of the triangle, it is possible to construct
a set of ballots that yield particular election outcomes. This approach
is demonstrated on a slide show with audio that was created as part of
Math Awareness Month 2008. (See “References
and Links.”)
The space of all possible ways that an electorate can vote – all
possible sets of ballots – can be embedded in a geometric object
called a simplex. An election procedure maps a point in the simplex to
an election outcome. For three candidates, the simplex is an equilateral
triangle – which motivated the above use of the equilateral triangle
to keep track of votes. Rather than view an election procedure as
a mapping from the discrete set of ballots, instead it is a mapping from
the continuous simplex. This allows well-established mathematical
techniques to be used to analyze election procedures.
For example, determining an election outcome under a voting vector is
equivalent to matrix multiplication. To see this, consider the
example from “Same Ballots, Many Elections.” This will
also reinforce how an election procedure maps the electorate’s votes
into a ranking of the candidates. The voting data is given in the
table below.
4 |
5 |
0 |
6 |
8 |
0 |
A |
A |
B |
B |
C |
C |
B |
C |
A |
B |
C |
A |
C |
B |
B |
A |
A |
C |
To determine the outcome under the voting vector (w1, w2,w3) with w1 ≥ w2 ≥ w3, the vector of the number of voters with different types of ballots is multiplied by a matrix made up of the weights, as shown below:
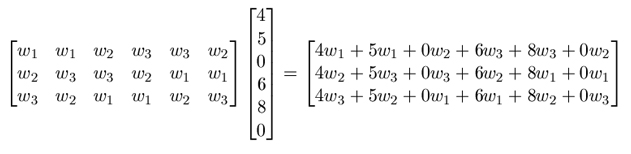
where
4w1 + 5w1 + 0w3 + 6w3 + 8w2 +
0w2 is the number of points that candidate A receives,
4w2 + 5w3 + 0w3 + 6w2 + 8w1 +
0w1 is the number of points that candidate B receives, and
4w3 + 5w2 + 0w1 + 6w1 + 8w2 +
0w3 is the number of points that candidate C receives.
Using the values for the weights as in the table below, the election
outcomes correspond with the example from “Same
Ballots, Many Outcomes.”
| |
w1 |
w2 |
w3 |
A |
B |
C |
Plurality |
1 |
0 |
0 |
9 |
8 |
6 |
Borda Count |
2 |
1 |
0 |
18 |
20 |
17 |
| |
7 |
4 |
0 |
63 |
96 |
94 |
Anti-plurality |
1 |
1 |
0 |
9 |
18 |
19 |
The election outcomes depend on which weights are used.
To review matrix multiplication, click here.
Discrete Math
Discrete math can be used to measure the closeness of different rankings of the n candidates. This is another type of geometry. For example, for three candidates, we know that there are six possible rankings of the candidates (see “How to Vote” for the number of rankings). Two rankings are next to one another if one ranking can be transformed to the other by switching two adjacent candidates in the ranking. For three candidates, each ranking of the candidates is next to two other rankings, the ones which switch the first- and second-place candidates and which switch the second- and third-place candidates. This discrete geometry is show below.
A |
|
A |
— |
C |
— |
C |
— |
B |
— |
B |
— |
A |
B |
|
C |
— |
A |
— |
B |
— |
C |
— |
A |
— |
B |
C |
|
B |
— |
B |
— |
A |
— |
A |
— |
C |
— |
C |
Notice that A preferred to B, and B preferred to C appears on both ends of the above figure. Each ranking can be viewed as a vertex (or dot) and each double arrow as an edge (or line). The graph associated with the above preferences is a hexagon, or a graph-theoretic cycle of length 6;
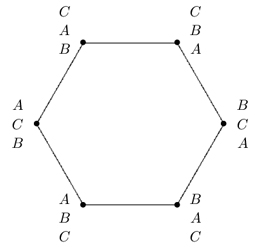
The number of voters with a particular ranking of the candidates is often placed on the appropriate vertex of the above graph. Election procedures that satisfy the Condorcet criterion, including Dodgson’s procedure, use distance along the graph to determine an election outcome. (See “From Impossibility to Possibilities” for the definition of Condorcet criterion and a brief description of Dodgson’s procedure.) This requires computing the minimum number of pairwise switches among the voters’ preferences necessary for there to be a Condorcet winner. Algorithmically, this is done by shifting voters along the hexagon until a Condorcet winner exists and counting the number of voters shifted and how far along the hexagon. As one can imagine, this is a complicated process. In fact, computer scientists have studied the complexity of computing the winner under the Dodgson procedure, as well as under the Kemeny rule and other election procedures.
And On …
 |
There is new mathematical
progress being made in voting theory all the time. A short
summary of some of the mathematics associated with voting theory
from the 2008 Joint Mathematics Meeting of the American Mathematical
Society and Mathematical Association of America appeared in the March
2008 issue (pages 15-17) of MAA FOCUS (the newsletter of
the Mathematical Association of America).
|
An article based on an American Mathematical Society Plenary Talk given by Donald G. Saari (University of California, Irvine) at the same meeting appeared in the April 2008 issue of the Notices of the American Mathematical Society,
to coincide with the 2008 installment of Math Awareness Month on “Mathematics and Voting.” The
American Statistical Association includes additional content on Math Awareness
Month 2008: Mathematics and Voting.